WARPAGE & SHRINKAGE OF FILLED & REINFORCED PLASTICS
If you're involved in the manufacture of injection molded reinforced thermoplastic parts, then it's cru-cial that you know how to determine and control both shrinkage and warpage. Otherwise, you will be unable to specify part dimensions and tolerances accurately, let alone reproduce them. This article explores the relationship between shrinkage and warpage, and offers guidelines on how filler and reinforcement systems can be used to reduce warpage problems in the production of plastic parts.
Injection molded parts are occasionally out of tolerance-not so much
because tools are cut to incorrect linear shrinkage rates, but because
parts warp and distort. To varying degrees, this situation can be corrected
if you are able to gauge shrinkage and estimate warpage behavior in advance.
All too often, shrinkage values listed on data sheets are thought
to indicate proba-ble part warpage. This information typically derives
from 5 in. x 1/2 in. x 1/8 in. rec-tangular bars measured in accordance
with ASTM D-955 test methods. These specimens, however, ignore the anisotropic
shrinkage characteristics of resins containing fiber reinforcements and/or
particulate fillers, and are used to report shrinkage in one direction
only-along the length of the bar. As a result, there is little correlation
between shrinkage values and the warpage factor.
Thus, data-sheet specifications provide only a portion of the information that molders, tool makers and design engineers need; and accepting them as reliable indicators of warpage can lead to severe tolerance prob¬lems. That ASTM D-955 shrinkage values do not necessarily correlate with warpage is made clear in Table 1.
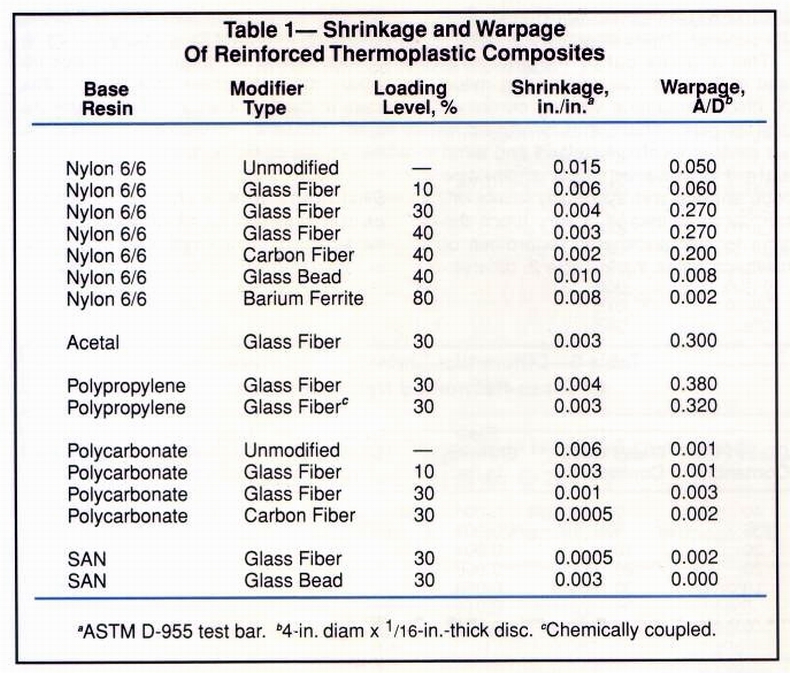
Shrinkage values of 5-in. test bars molded from a variety of resin systems are compared with the warpage of 4-in.-diam, edge-gated discs made from the same materials. The disks were 1/16 in. thick (Fig. 1).
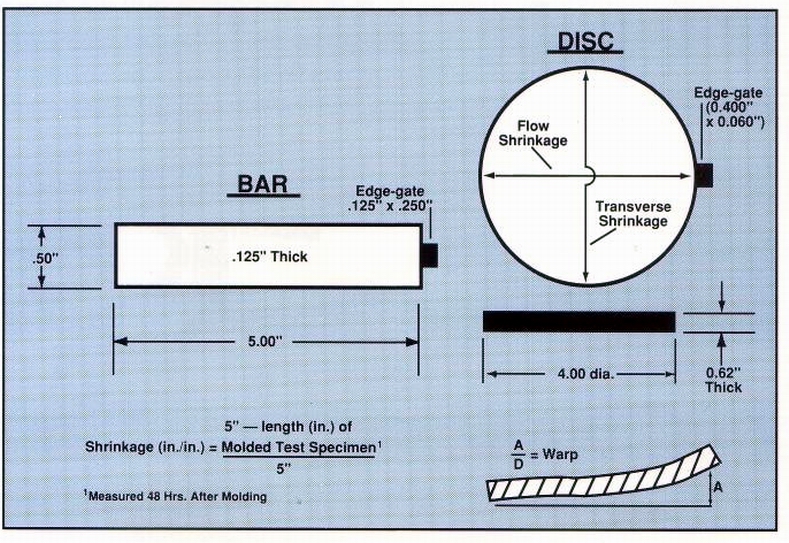
Figure 1
If we were to assume that low shrinkage signifies low warpage, then
we would expect 40% carbonfiber reinforced nylon 6/6 (with a shrinkage
rate of 0.002 in./in.) to warp less than 30% glass-bead-filled SAN (whose
shrinkage rate is 0.003 in./in.). But test results proved this assumption
incorrect. Warpage of the nylon disk was 0.200 - much higher than that
of the SAN part, which was less than 0.001.
(Warpage, incidentally, is determined by the ratio of the maximum
height (A) of the test specimen to the diameter (D). Hence, A/D = warpage.
See Fig. 1.) Table 1 also shows that increasing the fiber glass content
of nylon 6/6 reduces test-bar shrinkage while increasing disc warpage.
But, as described below, there are instances in which high fiber glass
loadings yield very low warpage. That's why additional information is needed
to supplement the shrinkage data derived from test bars alone. For example,
examining the shrinkage of discs and chips in perpendicular directions
(flow and transverse) affords a much more reliable method of predicting
part warpage. This is what we have done for a number of crystalline and
amorphous thermoplastics containing fiber reinforcements and/or particulate
fillers. Our objective was to establish guidelines for predicting warpage
on the basis of resin type, modifier and loading level.
In general, we found that what can be said of one fiber-reinforced
crystalline material (e.g., nylon or acetal) holds true for all similarly
modified crystalline resins. Much the same applies to amor¬phous thermoplastics
and identical cases can be made for resin systems containing particulate
fillers.
It should be noted that this article focuses on warpage resulting
from material composition, and not on warpage caused by part design. Warpage
owing to changes in section thickness is not considered. Also, since warpage
and distortion are more likely to account for out of tolerance parts than
the possibility that a tool was incorrectly cut, we do not provide specific
shrinkage rates for use in machining mold cavities. Rather, the data we
present merely indicates the warpage of sample composites and suggests
some guidelines as to how compounds can be modified to reduce this problem.
Warpage vs. shrinkage in crystalline resins Tables 2 and 3 reveal how the warpage of acetal and nylon discs relates to differential shrinkage, which is defined as the value obtained by subtracting shrinkage in the flow direction from that in the transverse direction (TS minus FS). In both cases, unmodified resins yielded the highest shrinkage rates, but neither the highest nor lowest warpage values. In addition, their shrinkage in the flow direction was greater than in the transverse direction, but this changed dramatically with the addition of glass fibers and beads.
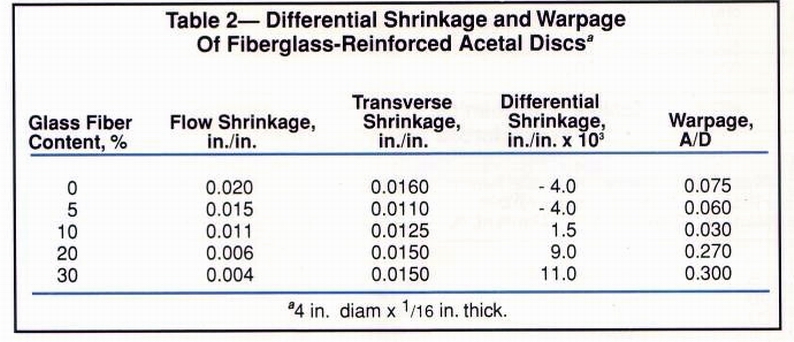
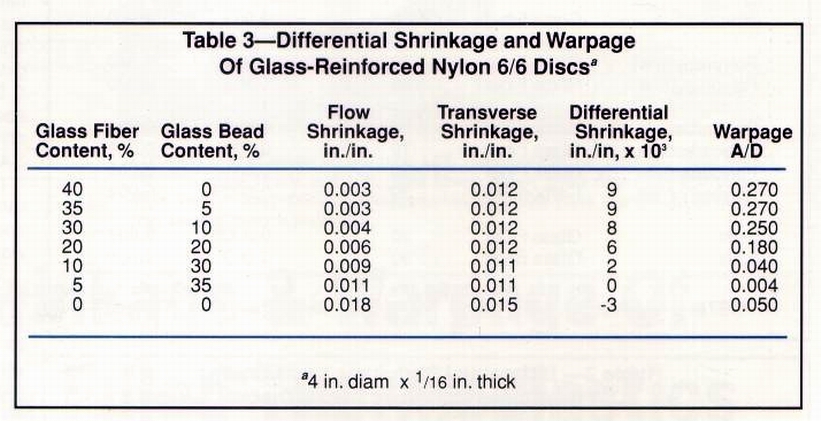
As fiber glass content rises in Table 2, shrinkage in the flow direction is greatly reduced. Transverse shrinkage, meanwhile, drops initially but soon edges upward and eventually reaches a plateau. At the outset, flow shrinkage is greater than that in the transverse direction. But at loading levels of 10% or higher, the situation is reversed. It can be seen that the absolute difference between flow and transverse shrinkage (i.e., differential shrinkage) correlates with warpage. As differential shrinkage increases, so does warpage. This was found to hold true for all thermoplastic resin systems investigated.
Figure 2 shows a graph of shrinkage rates in both directions plotted against fiber glass content.
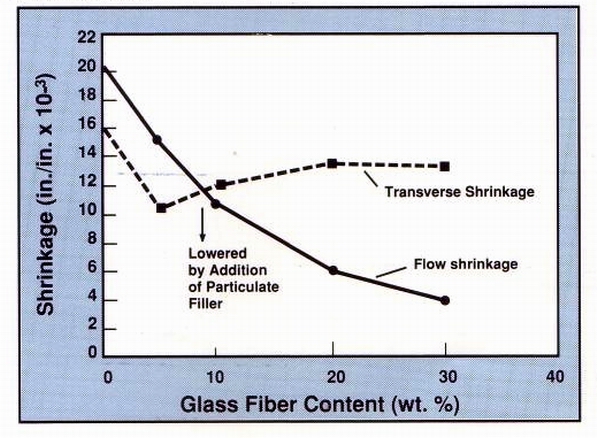
Figure 2
The warpage of acetal discs is lowest where the two curves intersect-roughly
at the 8% fiber glass loading level. Since we know that adding particulate
fillers yields both lower and more uniform shrinkage, it is reasonable
to assume that if such modifiers are incorporated along with this "optimal"
fiber glass loading, then overall shrinkage would be still lower. The resultant
was also applied to amorphous polycarbonate (Fig. 4). As in the case of
fiber glass reinforced acetal (Fig. 2), higher fiber loadings boosted the
warpage of the discs.
Figure 4 plots the flow and transverse shrinkage values of glass
reinforced polycarbonate. Shrinkage values for the unmodified resin were
identical in both directions, resulting in extremely low warpage (0.001).
At the 10% fiber glass level, shrinkage was reduced even further, while
remaining the same in both directions. As fiber glass content increased,
flow shrinkage dropped faster than transverse shrinkage, and the difference
between the two caused a slight increase in disc warpage.
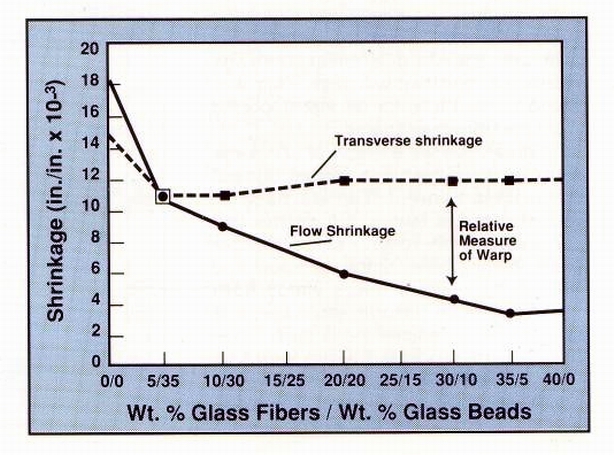
Figure 3
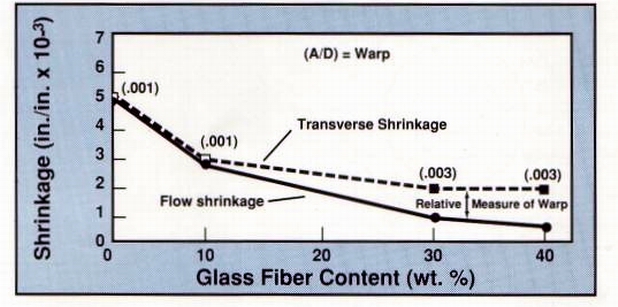
Figure 4
Particulate fillers yield lowest warpage values Another series of tests sought to determine how fillers with low aspect ratios affect shrinkage and warpage behavior in both crystalline and amorphous resins. Figure 5 shows the trends seen with nylon 6/6 and SAN compounds containing different amounts of glass beads.
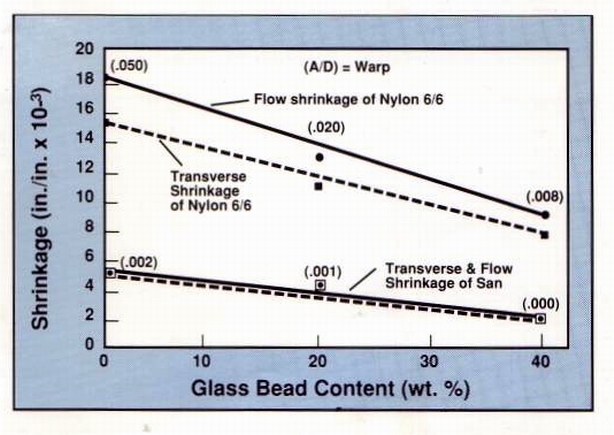
Figure 5
As increasing amounts of beads are added to the nylon composites,
overall shrinkage and the absolute difference between shrinkage values
in both directions decline. Flow shrinkage was greater than transverse
shrinkage throughout, and warpage dropped considerably with increasing
amounts of beads.
As for the bead-filled SAN discs, shrinkage was equal in both directions,
but as filler content increased, shrinkage and warpage were both reduced.
At all loading levels, values for amorphous SAN were much lower than those
for crystalline nylon. From this we can conclude that amorphous resins
containing particulate fillers exhibit the least warpage and hence the
greatest dimensional control, compared to amorphous materials with fiber
reinforcements and crystalline materials with either type of modifier.
Sacrificing properties for lower warpage It is important to note
that warpage reductions are accompanied by a loss in mechanical, impact
and thermal properties. This is made clear by studying the nylon 6/6 compounds
in Tables 4-6.

Table 4 indicates that 40% fiber glassreinforced nylon 6/6 has a flexural strength of 42,000 psi and disc warpage of 0.220. But the 5% fiber glass/35% bead compound, which has a low warpage of 0.004, has a much lower flexural strength value of only 23,000 psi. Tensile strength and flexural modulus values are also much lower for the compounds with the high glassbead loading.
In short, as fiber glass content drops and bead content rises, warpage
decreases significantly, but with a sacrifice in mechanical properties.
Table 4 also indicates that, of those materials listed, the highest mechanicals
were obtained with 40% carbon fiber filled nylon 6/6. And while the warpage
of this material was relatively high, it was still lower than that of the
40% fiber glassreinforced composite.
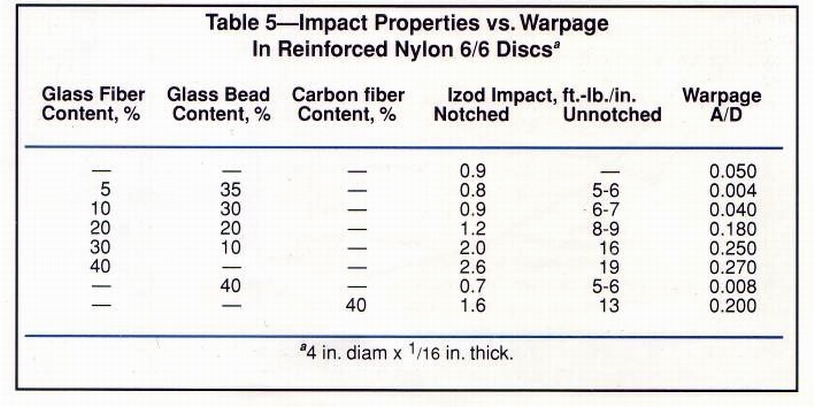
Similarly, Table 5 shows that as disc warpage is reduced by lowering
the fiber glass content and increasing the level of glass beads, impact
strength is sacri¬ficed, The composite with the lowest warpage has
a notched Izod impact value of 0.8 ft.-Ib/in., less than one-third that
of the 40% fiber glass-reinforced compound (2.6 ft-lb/in.). At 40% loadings,
the material containing carbon fibers exhibits lower warpage and impact
strength than the fiber glass-reinforced compound.
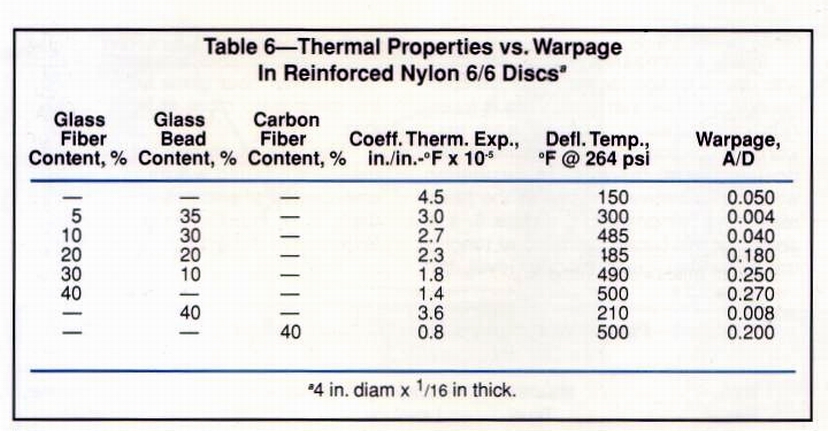
As for thermal properties, Table 6 indicates the coefficient of thermal expansion of the 40% fiber glass-reinforced nylon composite is less than half that of the 5% fiber/ 35% bead resin. As the fiber glass level is lowered and bead content is raised, yielding discs with progressively lower warpage, the coefficients of thermal expansion rise significantly.
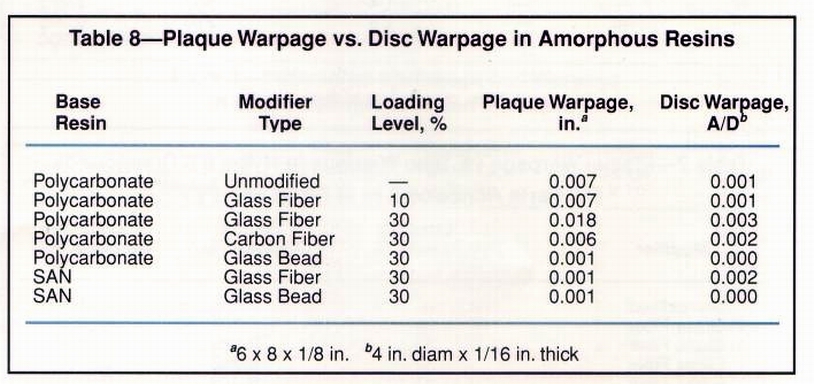
Measuring shrinkage and warpage with thicker specimens Additional experiments were conducted with 1/8-in. thick, center-grated plaques and 0.2-in. thick, T-shaped specimens (Figs. 6 & 7 respectively). Tables 7 and 8 show how the warpage of nylon, polycarbonate and SAN plaques compares with that of the discs mentioned earlier. Once again, various loadings of fiber glass, carbon fibers, glass beads and fiber/bead mixtures were examined.
Using scanning electron microscopy, the fiber orientation was analyzed. Fiber orientation in the plaque occurred radially from the center sprue gate, with fibers aligning themselves parallel to the direction of filling. But when the melt reached the cavity walls, the fibers turned and aligned themselves with the edge of the part. Across the width of the plaque at the sprue gate, flow shrinkage predominates. Further up the plaque where the fibers orient themselves with the plaque length, transverse shrinkage predominates. This varied fiber alignment produces the distorted shape shown in Fig. 6. The magnitude of the warpage was such that shrinkage rates within the plaques could not be determined. Ultimate warpage was measured as described in Fig. 6.
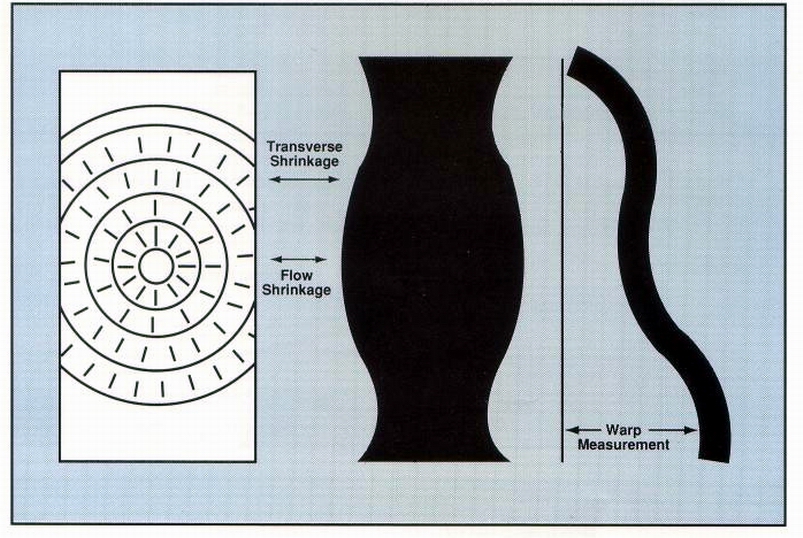
Figure 6
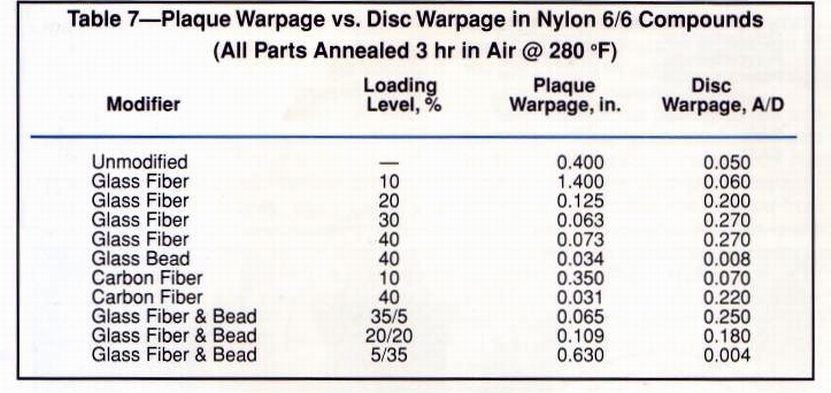
Table 7 compares plaque warpage with disc warpage for the nylon 6/6
compounds. It shows that while there is a correlation between plaque and
disc warpage for compounds containing particulate fillers, there is no
correlation whatsoever between those of the fiberreinforced composites.
In Figure 8, it is seen that the curves intersect at roughly the 15% fiber
glass loading level, but diverge both above and below that point. The plaques
appear to warp more at low fiber glass levels, while the discs warp more
at higher load¬ings.
The lack of correlation between plaque and disc warpage was an unexpected
phenomenon for which there is no satisfactory explanation. Differences
in part thickness, however, may provide a clue to this apparent contradiction
in behavior. At 1/8 in., the plaque is twice as thick as the disc. Doubling
the thickness increases part stiffness by a factor of eight. At the higher
glass loadings, the plaque is then sufficiently stiff to resist the internal
stresses created by differential shrinkage. Thus, the more fiber glass
added, the stiffer the part and the lower the warpage.
The thick walled (0.2-in.), T-shaped specimen was used to relate warpage to the fiber glass content of nylon com¬pounds at 10-50% loading levels (Fig. 7). A plot of warpage against glass content is shown in Figure 9. It is seen that warpage of the T -shaped part followed a curve similar to that of the reinforced nylon plaques in Figure 8. The initial addition of 10% fiber glass caused a sharp increase in warpage, relative to the unmodified resin. But as greater amounts of glass were incorporated, warpage decreased in a linear fashion and eventually dropped below that of the unmodified base resin.
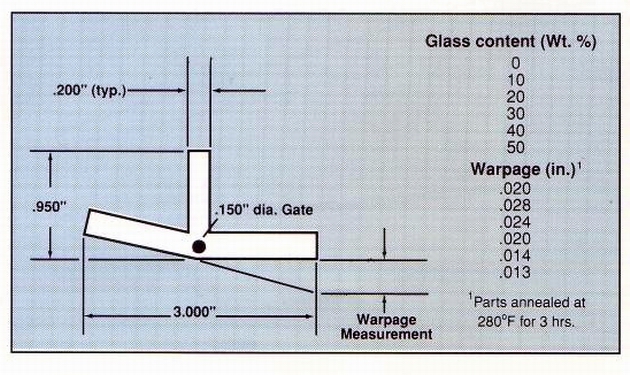
Figure 7
A series of plaques was also molded from amorphous polycarbonate and SAN, both fiber glass reinforced and bead filled. Table 8 compares the plaque warpage with disc warpage. Changes in warpage that resulted from raising and lowering the modifier levels followed the same trends in both plaques and discs. The warpage of both samples molded from 10% glass reinforced polycarbonate equaled that of the unmodified resin and as fiber glass content increased, so did warpage.
Summing up, Figures 2, 3, 4 and Table 8 show that the warpage of thin discs molded from fiber glass reiniforced crystalline and amorphous resins, as well as thick test samples made from amorphous materials, increases as glass content rises. Only do reinforced crystalline resins molded into thick shapes present an exception whereby raising the fiber glass content reduces warpage (Figure 7-9). What this means is that if a thick part is warping, you may be better off increasing the fiber glass loading. However, if a thin part is warping, you may have to do exactly the reverse.
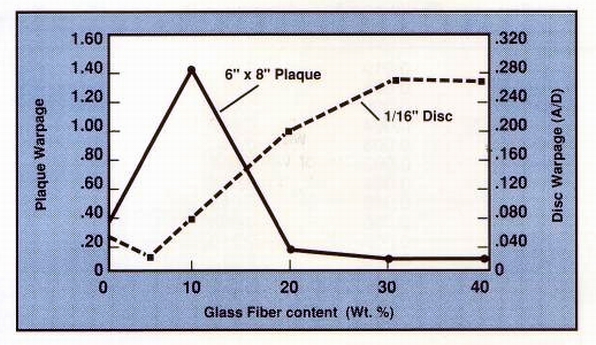
Figure 8
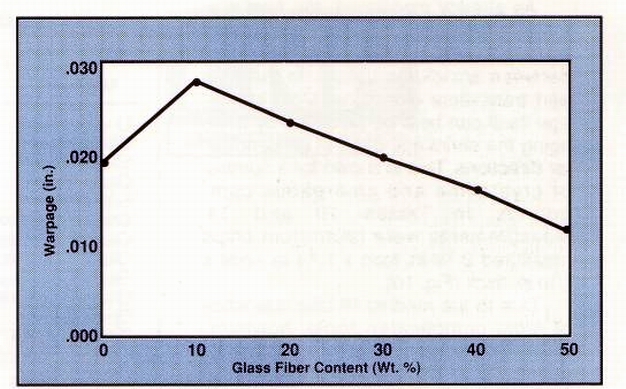
Figure 9
Can processing parameters affect warpage? Experiments were also conducted to determine whether warpage can be controlled by changing molding variables. Annealed and unannealed discs molded from 30% fiber glass reinforced nylon 6/6 were used. Individual parameters were increased and decreased from the norm while all other variables were kept at standard settings. Warpage was measured in the dry as molded state and after three hours of annealing at 280°F in air. The results are presented in Table 9. For the unannealed discs, it was found that decreased hold time caused a 30% increase in warpage, while decreased mold temperatures resulted in a 60% drop in warpage.
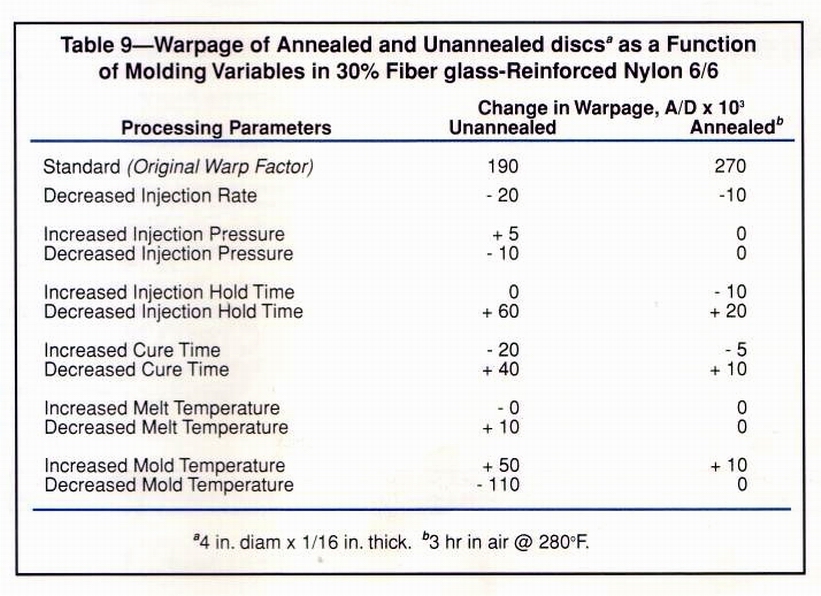
After the discs were annealed and remeasured, warpage of those molded under standard conditions increased considerably. But the variations that resulted from changing the processing parameters were, for the most part, eliminated. Decreased hold time was the only parameter that caused a change in warpage greater than 5% in the annealed samples.

The lower warpage variations of the annealed discs suggest that using the highest possible mold temperatures consistent with good molding practices and economics will yield parts that do not change dimension when exposed to elevated service temperatures.
Choosing the best test specimen The data described above provide some insight into the relative warpage of different composites and offer guidelines to follow when compounds have to be modified to reduce warpage. Data presented here does not indicate what shrinkage rates should be used when cutting a particular mold cavity.
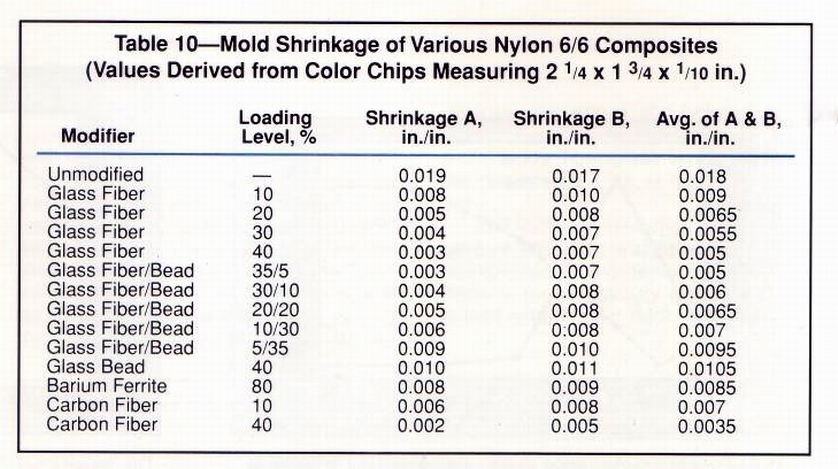
As already mentioned, the best way to use shrinkage behavior as an index of warpage is by obtaining the difference between shrinkage values in the flow and transverse directions. Mold shrinkage itself can best be predicted by averaging the shrinkage rates in perpendicular directions. This is shown for a number of crystalline and amorphous com¬pounds in Tables 10 and 11. Measurements were taken from chips measured 21ia in. long x 1 3/4 in. wide x 1 iio in. thick (Fig. 10).
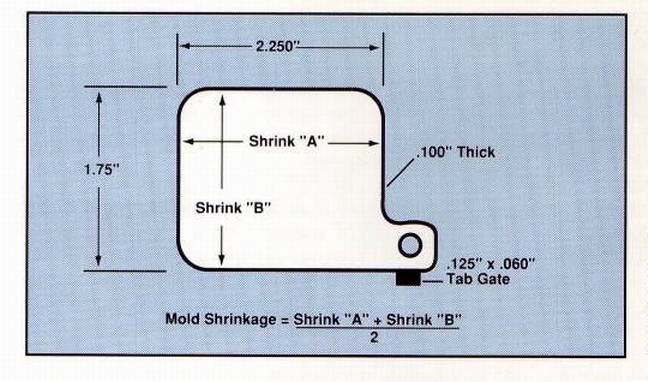
Figure 10
Due to the random fill characteristics of most complicated tools, however, most dimensions do not fall exactly perpendicular or parallel to the direction of fiber orientation. Thus, if shrinkage in perpendicular directions cannot be obtained, or if only one shrinkage value is available for determining how to machine the mold, then the best way to arrive at this value is to make test samples in a configuration similar to that of the finished part. If this is not possible, then the best specimen for generating shrinkage data should meet these criteria:
It should be gated so that the mold is filled as randomly as possible.
It should be sufficiently small so that warpage does not
prevent accurate part measurement.
Its thickness should be as close as possible to that of the finished
part.
We think the color chip specimen in Figure 10 meets all these criteria.
The average of the shrinkage values in per¬pendicular directions should
provide a good estimate of the shrinkage rate to be applied in cutting
a mold. Except in the case of thick walled, fiber reinforced crystalline
compounds, the average of the two shrinkage values should serve as a reasonable
gauge of final part shrinkage.